 |
TITLE:
Beyond Analysis: Interactive and Graph-Based Modeling of Complex Information Spaces
CLIENT:
Dr. Halil Erhan
CONTACT:
herhan@sfu.ca
OVERVIEW:
One of the fundamental utility of graph-based information network visualization is navigating and analyzing a large information space composed of associated information pieces. An example of such information space is flight paths and schedules over a geographic area that is either generated by a flight scheduling system or retrieved from real-time data records. The systems that provide analysis functions usually do not allow interactive modeling or modification of the information space. Information is visualized only for the analysis purposes and system and information space has unidirectional association. However, the opportunity of changing the content of information space when needed is missed. The information space can be edited on the same representation if bidirectional association can be established. Examples of when such editing functions are needed are design-decision making; complex system requirements specification; business network management; building large-scale geographic information models; system configuration management; complex ontology building etc. This research aims at developing a prototype application as an extension on an existing graph-visualization system to explore the utility of graph-visualization models and systems for altering the information space they represent.
PROJECT GOALS:
- Literature review on graph-based visualization and modeling of information networks.
- Conducting three case studies with different graph-visualization tools to demonstrate utility for editable information spaces
- Extending one of the (open source) graph-based visualization tools to make the information space editable.
- Experimenting with the tool to measure utility and possible application domains.
PROJECT DESCRIPTION:
The project aims to extend the utility of graph-based information visualization systems to include the functions for modeling and editing of information spaces composed of related information pieces. For example design requirements specifications of a complex system can be modeled using graph-based representations: nodes represent requirements and constraints, and references between them form the links on a graph. Furthermore if there are parametric relationships between the requirements and constraints exist, they can be visualized, modeled, and modified on either extended or specialized graphs. If the design team wishes to change a note or association between two nodes, the graph-model can be used directly to alter the information space, e.g. specifications. Similar information spaces can also be interactively created using graph-based models. Given the existing functions provided for navigation and analysis in the graph-based visualization tools, modeling complex information spaces more plausible.
IMAGE[s] or URLs that exemplify project concept or research area
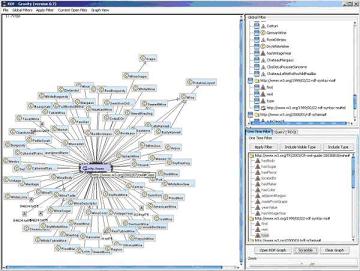
Figure 1. RDF Gravity (RDF Graph Visualization Tool)
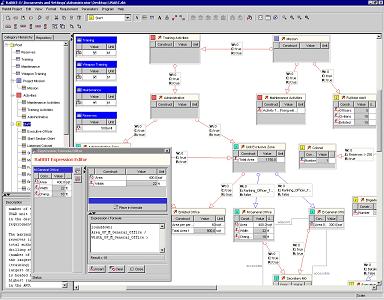
Figure 2. RaBBiT (Requirements Configuration Tool)
DELIVERABLES:
Case reports
System design and implementation
Utility and usability testing reports
SKILLS REQUIRED:
Conducting usability experiments
Software design; use of Java programming language and APIs
Eager to learn new skills!
RESOURCES (if applicable)
Necessary software will be provided by the client
Expenses for experiments will be provided by the client